> ## Documentation Index
> Fetch the complete documentation index at: https://docs.biscuit.so/llms.txt
> Use this file to discover all available pages before exploring further.
# Analytics: page views, referrers, Core Web Vitals
> Built-in analytics ship with every app. See page views, top pages, time on page, referrers, locations, devices, and Core Web Vitals on the dashboard.
export const faqSchema = {
"@context": "https://schema.org",
"@type": "FAQPage",
"mainEntity": [
{ "@type": "Question", "name": "Do I need to set up Google Analytics or any other tool?", "acceptedAnswer": { "@type": "Answer", "text": "No. Analytics ships with every Biscuit app. The data shows up in the project side nav as soon as your app starts getting traffic." } },
{ "@type": "Question", "name": "Why is the Things people do panel empty?", "acceptedAnswer": { "@type": "Answer", "text": "That panel only fills once you start tracking custom events. Ask Biscuit to track any action you want to count beyond page views (button clicks, form submits, conversions)." } }
]
};
Every Biscuit app comes with analytics built in. You don't have to drop in a tracking script, sign up for Google Analytics, or write any code to count visitors. Open *Analytics* in the side nav and the data is already there.
## What's tracked automatically
The framework wires three events into every app:
* Page views, on every route change
* Time on page, when someone leaves a page or closes the tab
* Core Web Vitals (LCP, FCP, INP, CLS, TTFB), on page load
You don't write any code for these. Page-view counts, top pages, time on page, and bounce rate all populate automatically.
## What you'll see on the dashboard
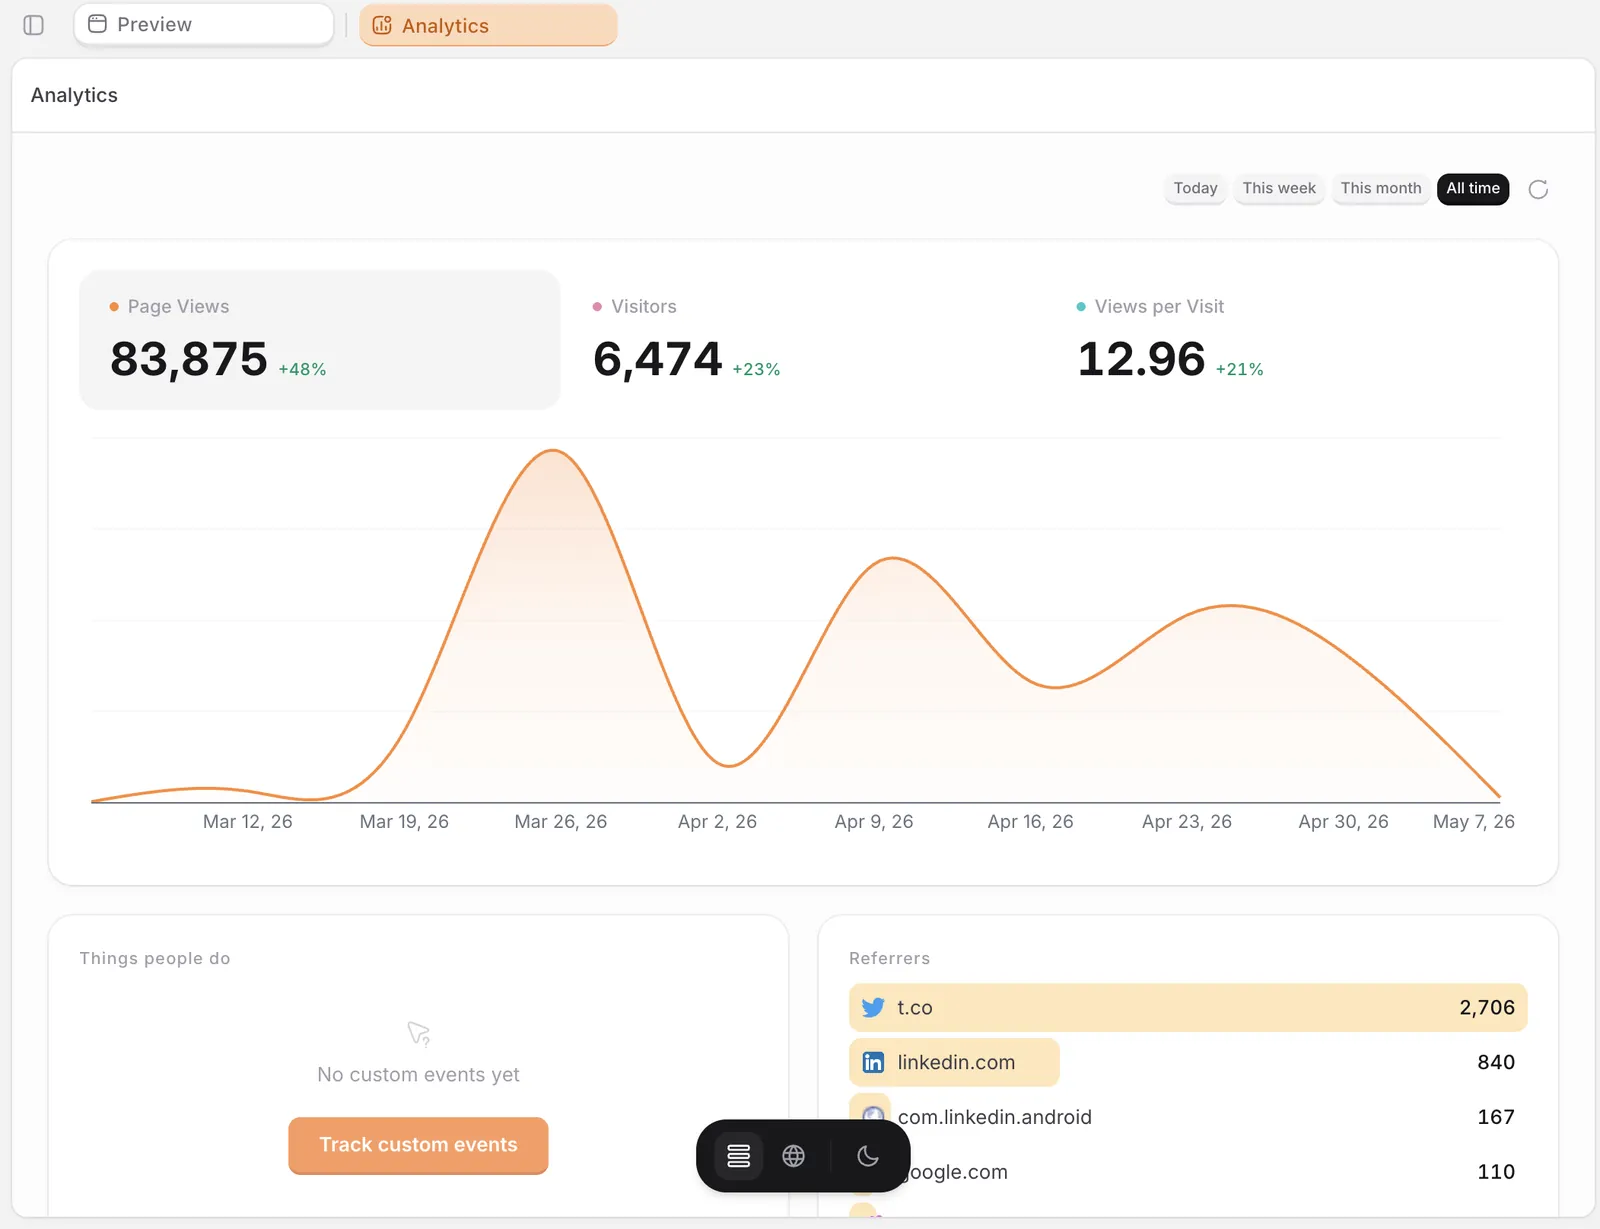
Open *Analytics* from the project side nav. The default view shows:
* KPIs at the top: page views, visitors, and views per visit, each with the change vs. the previous period
* A line chart of page views over the selected period (*Today*, *This week*, *This month*, or *All time*)
* Top pages with average time on page and visit count
* Referrers showing where visitors came from (Twitter, LinkedIn, Google, direct, and so on)
* Locations and devices breakdowns
* Engagement: avg time on page, bounce rate, pages per visitor, and the most engaging page
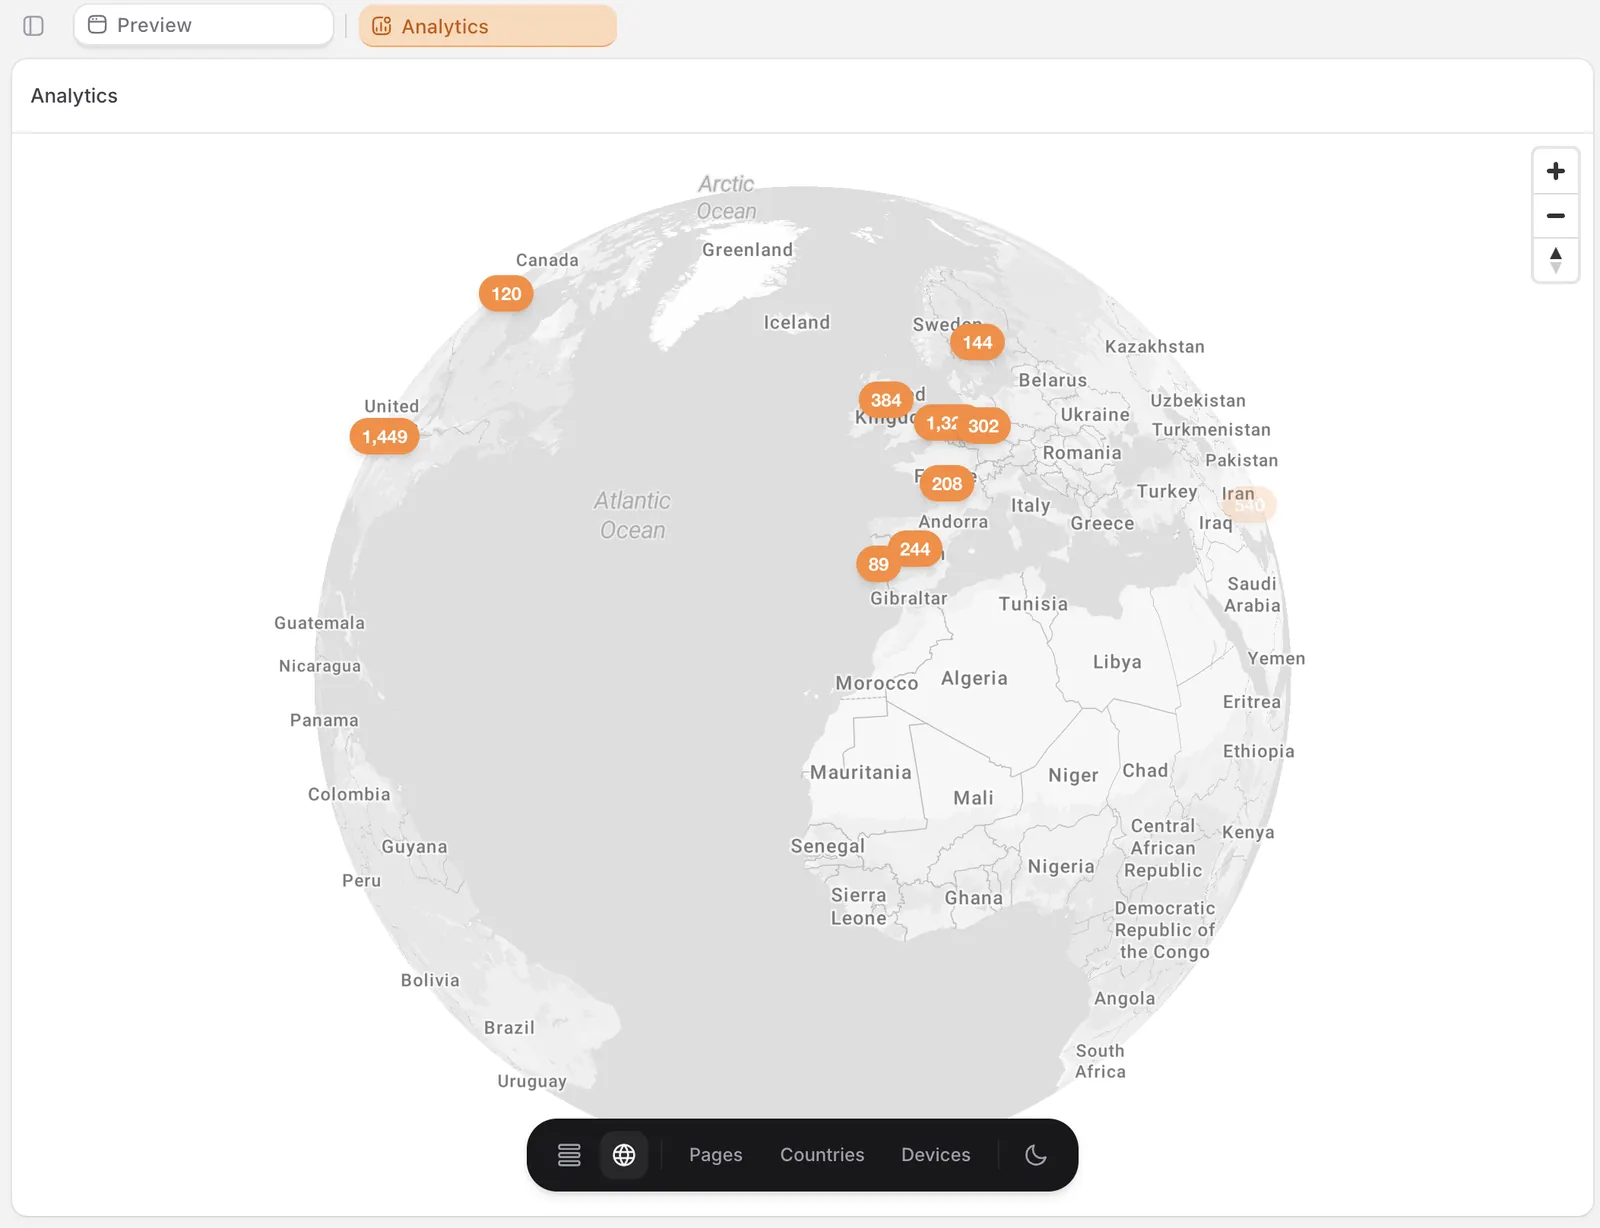
There's also a *Globe view* (toggle at the bottom) for a 3D map of where your visitors are, with filter pills for *Pages*, *Countries*, and *Devices*.
 ## Track custom events
Page views are pre-wired, but if you want to track specific actions like a Sign Up click, a checkout completion, or a plan selection, you can. Open chat and describe what you want to track. For example:
* "Track a custom event when someone clicks the Sign Up button on the landing page."
* "Add tracking for the Buy button on the checkout page, including which plan was selected."
* "Track when a user marks a recipe as favorite."
Biscuit wires the tracking in the right place and the event shows up in the *Things people do* panel on the dashboard.
A few things help these events stay readable later:
* If you want to define the event name yourself, your prompt should include a short, descriptive name like `sign_up_clicked` or `checkout_completed`. Avoid generic names like `click` or `button`, since the dashboard can't tell sign-up clicks from checkout clicks if they share a name.
* In your prompt, include two or three relevant details, like: which item, which plan, which source. Biscuit handles this automatically when you describe the action specifically.
**Try this prompt**
```
Track a custom event when someone clicks the Get Started button on the home page.
```
## FAQ
No. Analytics ships with every Biscuit app. The data shows up in the project side nav as soon as your app starts getting traffic.
That panel only fills once you start tracking custom events. Ask Biscuit to track any action you want to count beyond page views (button clicks, form submits, conversions).
## Up next
Trigger emails on signup, milestones, or schedules.
Your app has its own email address.
From prompt to a live app on a custom domain.
## Track custom events
Page views are pre-wired, but if you want to track specific actions like a Sign Up click, a checkout completion, or a plan selection, you can. Open chat and describe what you want to track. For example:
* "Track a custom event when someone clicks the Sign Up button on the landing page."
* "Add tracking for the Buy button on the checkout page, including which plan was selected."
* "Track when a user marks a recipe as favorite."
Biscuit wires the tracking in the right place and the event shows up in the *Things people do* panel on the dashboard.
A few things help these events stay readable later:
* If you want to define the event name yourself, your prompt should include a short, descriptive name like `sign_up_clicked` or `checkout_completed`. Avoid generic names like `click` or `button`, since the dashboard can't tell sign-up clicks from checkout clicks if they share a name.
* In your prompt, include two or three relevant details, like: which item, which plan, which source. Biscuit handles this automatically when you describe the action specifically.
**Try this prompt**
```
Track a custom event when someone clicks the Get Started button on the home page.
```
## FAQ
No. Analytics ships with every Biscuit app. The data shows up in the project side nav as soon as your app starts getting traffic.
That panel only fills once you start tracking custom events. Ask Biscuit to track any action you want to count beyond page views (button clicks, form submits, conversions).
## Up next
Trigger emails on signup, milestones, or schedules.
Your app has its own email address.
From prompt to a live app on a custom domain.